I’ve found code coverage to be quite a useful tool when writing unit tests. Code coverage gives a good indication of things you may have missed in your unit tests, and is useful as a reference when you’re writing them.
The code coverage tool that ships with certain editions of Visual Studio which I sometimes use is good, but those editions are pretty pricy, making it a non-starter for me if I want code coverage for my little private projects. Fortunately, there’s a decent code coverage tool for .NET named PartCover which works really well. This article goes over how to get started using PartCover with NUnit 2.5.7.
You’ll want a project with NUnit tests to try this out. If you don’t have one, you can always grab the source for NUnit Results Explorer and build it – there’re a couple of test projects in there. Once you’ve downloaded and installed PartCover, simply start up the PartCover Browser. Your first port of call should be File -> Run Target…

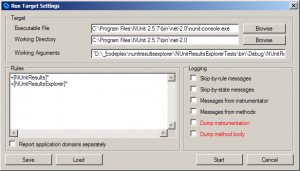
Here I’ve filled out all the necessary information. We’re using the nunit-console.exe executable to run the tests using its directory as the working directory. The arguments we’re supplying are just the full paths to the test assemblies, in this case NUnitResultsTests.dll and NUnitResultsExplorerTests.dll.
The section that stops everyone in their tracks is the Rules box, but it’s pretty simple once you know the following:
- Use a + for inclusions and a – for exclusions.
- Specify the names of assemblies to include within square brackets.
- After the assembly name, you can put a namespace.
- Use an asterisk (*) to represent 0 or more unspecified characters.
The rules defined in the screenshot include all namespaces in the NUnitResults and NUnitResultsExplorer assemblies, which are the ones being tested by our test assemblies.
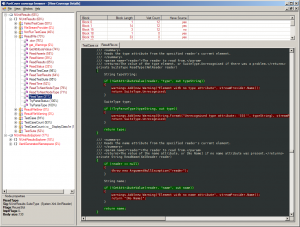
Next hit Start, and after the NUnit console has fired up and gone away again, you’ll be able to browse the results. The first thing to do after this is to click Views -> View Coverage Details. You’re then free to browse the coverage results using the tree view on the left and view which lines of code got executed and which didn’t.

It looks like the golden path has fairly decent coverage, but it’s fairly obvious that I need a little more discipline in covering those corner cases!